pygmt.Figure.ternary
- Figure.ternary(data, cmap=False, fill=None, width=None, pen=None, alabel=None, blabel=None, clabel=None, no_clip=False, region=None, frame=False, verbose=False, panel=False, perspective=False, transparency=None, **kwargs)
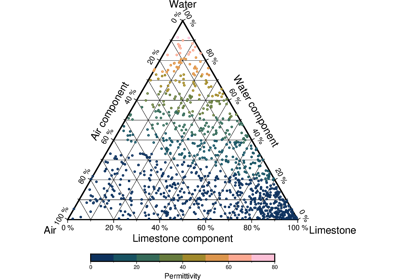
Plot data on ternary diagrams.
Reads (a,b,c[,z]) records from data and plots symbols at those locations on a ternary diagram. If a symbol is selected and no symbol size given, then we will interpret the fourth column of the input data as symbol size. Symbols whose size is <= 0 are skipped. If no symbols are specified then the symbol code (see
stylebelow) must be present as last column in the input. Ifstyleis not specified then we instead plot lines or polygons.Full GMT docs at https://docs.generic-mapping-tools.org/6.7/ternary.html.
Aliases:
S = style
B = frame
C = cmap
G = fill
JX = width
L = alabel/blabel/clabel
N = no_clip
R = region
V = verbose
W = pen
c = panel
p = perspective
t = transparency
- Parameters:
data (
str|PathLike|dict|ndarray|DataFrame|Dataset|GeoDataFrame) – Pass in either a file name to an ASCII data table, a Python list, a 2-Dnumpy.ndarray, apandas.DataFrame, anxarray.Datasetmade up of 1-Dxarray.DataArraydata variables, or ageopandas.GeoDataFramecontaining the tabular data.width (
float|str|None, default:None) – Set the width of the plot by passing a number followed by a dimension unit. Use a negative width to indicate that positive axes directions be clock-wise [Default lets the a, b, c axes be positive in a counter-clockwise direction].region (
Sequence[float|str] |str|None, default:None) – [amin, amax, bmin, bmax, cmin, cmax]. Give the min and max limits for each of the three axes a, b, and c.frame (
Frame|Axis|Literal['none'] |str|Sequence[str] |bool, default:False) – Set frame and axes attributes for the plot. It can be a bool,"none", apygmt.params.Frameorpygmt.params.Axisobject. Raw GMT strings or sequences of strings are also supported for backward compatibility. Ifframe=True, the frame will be drawn with the default attributes. Ifframe="none", no frame will be drawn. Use apygmt.params.Frameorpygmt.params.Axisobject for more control over the attributes of the frame and axes. A tutorial is available at frame and axes attributes. Full documentation is at https://docs.generic-mapping-tools.org/6.7/gmt.html#b-full. For ternary diagrams, usepygmt.params.Framexaxis,yaxis, andzaxisattributes to set the a, b, and c axes, respectively.cmap (
str|bool, default:False) – File name of a CPT file or a series of comma-separated colors (e.g., color1,color2,color3) to build a linear continuous CPT from those colors automatically.alabel (
str|None, default:None) – Set the label for the a vertex where the component is 100%. The label is placed at a distance of three times the MAP_LABEL_OFFSET setting from the corner.blabel (
str|None, default:None) – Same asalabelbut for the b vertex.clabel (
str|None, default:None) – Same asalabelbut for the c vertex.style (str) – symbol[size]. Plot individual symbols in a ternary diagram.
pen (
str|None, default:None) – Set pen attributes for the outlines of symbols or lines.fill (
str|None, default:None) – Set color or pattern for filling of symbols [Default is no fill].no_clip (
bool, default:False) – Do not clip symbols to the ternary diagram [Default plots points whose coordinates are strictly inside the plot border].verbose (
Literal['quiet','error','warning','timing','info','compat','debug'] |bool, default:False) – Select verbosity level [Full usage].panel (
int|Sequence[int] |bool, default:False) –Select a specific subplot panel. Only allowed when used in
Figure.subplotmode.Trueto advance to the next panel in the selected order.index to specify the index of the desired panel.
(row, col) to specify the row and column of the desired panel.
The panel order is determined by the
Figure.subplotmethod. row, col and index all start at 0.perspective (
Perspective|float|Sequence[float] |bool, default:False) – Select perspective view and set the viewpoint. Pass apygmt.params.Perspectiveobject to control the viewpoint. Alternatively, setperspective=Trueto reuse the perspective setting from the previous plotting method. It also accepts following shortcuts: a single value azimuth, a sequence of two values (azimuth, elevation), or a sequence of three values (azimuth, elevation, level). Refer topygmt.params.Perspectivefor meaning of the parameters.transparency (
float|None, default:None) – Set transparency level, in [0-100] percent range [Default is0, i.e., opaque]. Only visible when PDF or raster format output is selected. Only the PNG format selection adds a transparency layer in the image (for further processing).