pygmt.Figure.basemap
- Figure.basemap(projection=None, zscale=None, zsize=None, region=None, frame=False, map_scale=None, compass=None, rose=None, box=False, verbose=False, panel=False, coltypes=None, perspective=False, transparency=None, **kwargs)
Plot base maps and frames.
Creates a basic or fancy basemap with axes, fill, and title. Several map projections are available, and separate tick-mark intervals for axis annotation, ticks, and gridlines can be specified.
If not in subplot mode (see
pygmt.Figure.subplot), at least one of the parametersframe,map_scale,rose, orcompassmust be specified.Note
Parameters
map_scale,rose, andcompassare deprecated since 0.19.0 in favor of the dedicated higher-level methods:pygmt.Figure.scalebar: Add a scale bar on the plot.pygmt.Figure.directional_rose: Add a directional rose on the plot.pygmt.Figure.magnetic_rose: Add a magnetic rose on the plot.
These methods provide more comprehensive and flexible APIs for their respective plot elements. The
boxparameter inpygmt.Figure.basemapis retained only as a compatibility parameter for these legacy parameters. For new code, prefer theboxparameter on the dedicated methods instead.Full GMT docs at https://docs.generic-mapping-tools.org/6.7/basemap.html.
Aliases
B = frame
F = box
J = projection
Jz = zscale
JZ = zsize
L = map_scale
R = region
Td = rose
Tm = compass
V = verbose
c = panel
f = coltypes
p = perspective
t = transparency
- Parameters:
projection (
str|None, default:None) – projcode[projparams/]width|scale. Select map projection.region (
Sequence[float|str] |str|None, default:None) – [xmin, xmax, ymin, ymax] or xmin/xmax/ymin/ymax[+r][+uunit]. Specify the region of interest. Required if this is the first plot command.frame (
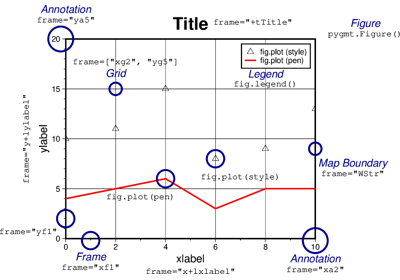
Frame|Axis|Literal['none'] |str|Sequence[str] |bool, default:False) – Set frame and axes attributes for the plot. It can be a bool,"none", apygmt.params.Frameorpygmt.params.Axisobject. Raw GMT strings or sequences of strings are also supported for backward compatibility. Ifframe=True, the frame will be drawn with the default attributes. Ifframe="none", no frame will be drawn. Use apygmt.params.Frameorpygmt.params.Axisobject for more control over the attributes of the frame and axes. A tutorial is available at frame and axes attributes. Full documentation is at https://docs.generic-mapping-tools.org/6.7/gmt.html#b-full.zsize (
float|str|None, default:None) – Set z-axis scaling or z-axis size.map_scale (
str|None, default:None) –Draw a map scale bar on the plot.
Deprecated since version 0.19.0: Use
pygmt.Figure.scalebarinstead. This parameter is maintained for backward compatibility and accepts raw GMT CLI strings for the-Loption.compass (
str|None, default:None) –Draw a map magnetic rose on the map.
Deprecated since version 0.19.0: Use
pygmt.Figure.magnetic_roseinstead. This parameter is maintained for backward compatibility and accepts raw GMT CLI strings for the-Tmoption.rose (
str|None, default:None) –Draw a map directional rose on the map.
Deprecated since version 0.19.0: Use
pygmt.Figure.directional_roseinstead. This parameter is maintained for backward compatibility and accepts raw GMT CLI strings for the-Tdoption.box (
Box|str|bool, default:False) –Draw a background box behind the scalebar, directional rose, or magnetic rose.
Deprecated since version 0.19.0: Use the
boxparameter inpygmt.Figure.scalebar,pygmt.Figure.directional_rose, orpygmt.Figure.magnetic_roseinstead. This parameter is maintained for backward compatibility and accepts either apygmt.params.Boxobject, a raw GMT CLI string, orTruefor the-Foption. Onpygmt.Figure.basemap, it only applies when used together with the legacymap_scale,rose, orcompassparameters.verbose (
Literal['quiet','error','warning','timing','info','compat','debug'] |bool, default:False) – Select verbosity level [Full usage].panel (
int|Sequence[int] |bool, default:False) –Select a specific subplot panel. Only allowed when used in
Figure.subplotmode.Trueto advance to the next panel in the selected order.index to specify the index of the desired panel.
(row, col) to specify the row and column of the desired panel.
The panel order is determined by the
Figure.subplotmethod. row, col and index all start at 0.coltypes (
str|None, default:None) – Specify the types of the coordinates given viaregion. See https://docs.generic-mapping-tools.org/6.7/gmt.html#f-full for details.perspective (
Perspective|float|Sequence[float] |bool, default:False) – Select perspective view and set the viewpoint. Pass apygmt.params.Perspectiveobject to control the viewpoint. Alternatively, setperspective=Trueto reuse the perspective setting from the previous plotting method. It also accepts following shortcuts: a single value azimuth, a sequence of two values (azimuth, elevation), or a sequence of three values (azimuth, elevation, level). Refer topygmt.params.Perspectivefor meaning of the parameters.transparency (
float|None, default:None) – Set transparency level, in [0-100] percent range [Default is0, i.e., opaque]. Only visible when PDF or raster format output is selected. Only the PNG format selection adds a transparency layer in the image (for further processing).
See also
pygmt.Figure.directional_roseAdd a map directional rose.
pygmt.Figure.magnetic_roseAdd a map magnetic rose.
pygmt.Figure.scalebarAdd a scale bar.
Examples
>>> import pygmt
>>> fig = pygmt.Figure()
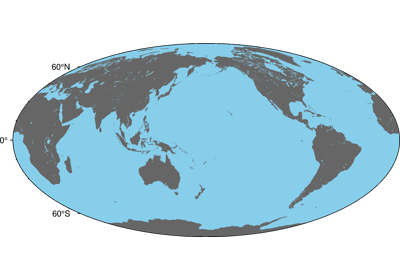
>>> fig.basemap(region="g", projection="H15c", frame=True)
>>> fig.show()
Examples using pygmt.Figure.basemap








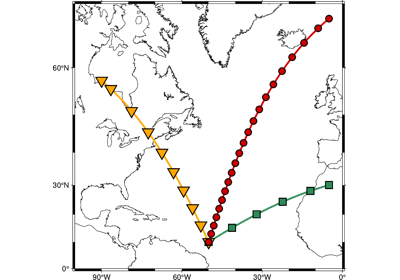
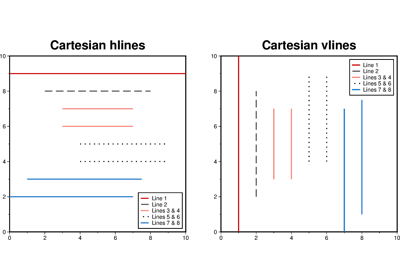
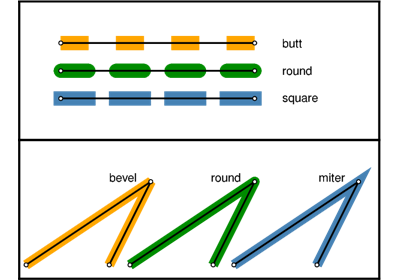
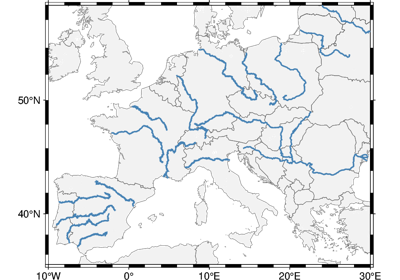
GeoPandas: Plotting lines with LineString or MultiLineString geometry



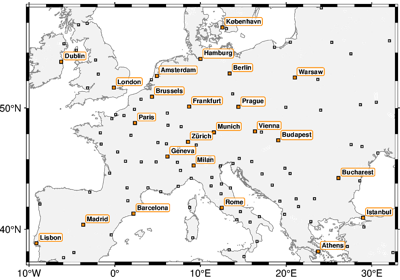
GeoPandas: Plotting points with Point or MultiPoint geometry