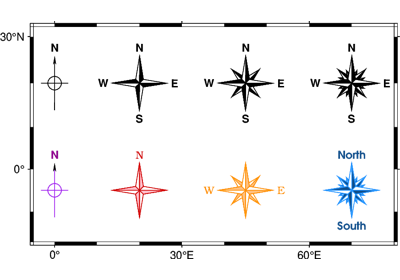
pygmt.Figure.directional_rose
- Figure.directional_rose(position=None, width=None, fancy=False, labels=False, box=False, verbose=False, panel=False, perspective=False, transparency=None)
Add a directional rose on the map.
- Parameters:
position (
Position|Sequence[float|str] |Literal['TL','TC','TR','ML','MC','MR','BL','BC','BR'] |None, default:None) –Position of the directional rose on the plot. It can be specified in multiple ways:
A
pygmt.params.Positionobject to fully control the reference point, anchor point, and offset.A sequence of two values representing the x- and y-coordinates in plot coordinates, e.g.,
(1, 2)or("1c", "2c").A 2-character justification code for a position inside the plot, e.g.,
"TL"for Top Left corner inside the plot.
If not specified, defaults to the Top Right corner of the plot.
width (
float|str|None, default:None) – Width of the rose in plot coordinates, or append unit%for a size in percentage of plot width [Default is 10%].fancy (
Literal[1,2,3] |bool, default:False) –Get a fancy rose. The fanciness level can be set to 1, 2, or 3:
Level 1 draws the two principal E-W, N-S orientations
Level 2 adds the two intermediate NW-SE and NE-SW orientations
Level 3 adds the four minor orientations WNW-ESE, NNW-SSE, NNE-SSW, and ENE-WSW
If set to
True, defaults to level 1.labels (
Sequence[str] |bool, default:False) – A sequence of four strings to label the cardinal points W, E, S, N. Use an empty string to skip a specific label. If set toTrue, default labels are used (["W", "E", "S", "N"]for a fancy rose and["", "", "", "N"]for a simple rose).box (
Box|bool, default:False) – Draw a background box behind the directional rose. If set toTrue, a simple rectangular box is drawn using MAP_FRAME_PEN. To customize the box appearance, pass apygmt.params.Boxobject to control style, fill, pen, and other box properties.verbose (
Literal['quiet','error','warning','timing','info','compat','debug'] |bool, default:False) – Select verbosity level [Full usage].panel (
int|Sequence[int] |bool, default:False) –Select a specific subplot panel. Only allowed when used in
Figure.subplotmode.Trueto advance to the next panel in the selected order.index to specify the index of the desired panel.
(row, col) to specify the row and column of the desired panel.
The panel order is determined by the
Figure.subplotmethod. row, col and index all start at 0.perspective (
Perspective|float|Sequence[float] |bool, default:False) – Select perspective view and set the viewpoint. Pass apygmt.params.Perspectiveobject to control the viewpoint. Alternatively, setperspective=Trueto reuse the perspective setting from the previous plotting method. It also accepts following shortcuts: a single value azimuth, a sequence of two values (azimuth, elevation), or a sequence of three values (azimuth, elevation, level). Refer topygmt.params.Perspectivefor meaning of the parameters.transparency (
float|None, default:None) – Set transparency level, in [0-100] percent range [Default is0, i.e., opaque]. Only visible when PDF or raster format output is selected. Only the PNG format selection adds a transparency layer in the image (for further processing).
Examples
>>> import pygmt
>>> fig = pygmt.Figure()
>>> fig.basemap(region=[0, 80, 0, 30], projection="M10c", frame=True)
>>> fig.directional_rose()
>>> fig.show()