pygmt.Figure.choropleth
- Figure.choropleth(data, column, cmap=True, intensity=None, pen=None, no_clip=False, projection=None, region=None, frame=False, verbose=False, panel=False, perspective=False, transparency=None)
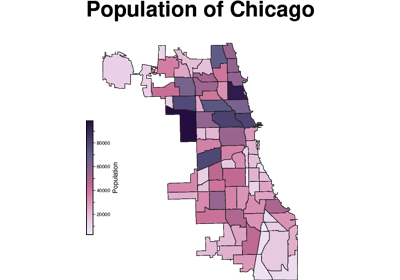
Plot a choropleth map.
This method creates a choropleth map by filling each polygon according to an attribute value. It requires the input data to be a geo-like Python object that implements
__geo_interface__and includes the values used to fill the polygons as an attribute field (e.g. ageopandas.GeoDataFrame), or an OGR_GMT file containing the geometry and data to plot.Aliases:
B = frame
C = cmap
I = intensity
J = projection
N = no_clip
R = region
V = verbose
W = pen
a = column
c = panel
p = perspective
t = transparency
- Parameters:
data (
GeoDataFrame|str|PathLike) – A geo-like Python object which implements__geo_interface__and includes the values used to fill the polygons as an attribute field (e.g. ageopandas.GeoDataFrame), or an OGR_GMT file containing the geometry and data to plot.column (
str) – The name of the data column to use for the fill.cmap (
str|bool, default:True) – The CPT to use for filling the polygons. If set toTrue, the current CPT will be used.intensity (
float|None, default:None) – The intensity (nominally in the ±1 range) to modulate the fill color by simulating illumination [Default is no illumination].no_clip (
bool, default:False) – Do not clip polygons that fall outside the frame boundaries.pen (
str|None, default:None) – Set pen attributes for lines or the outline of symbols.projection (
str|None, default:None) – projcode[projparams/]width|scale. Select map projection.region (
Sequence[float|str] |str|None, default:None) – [xmin, xmax, ymin, ymax] or xmin/xmax/ymin/ymax[+r][+uunit]. Specify the region of interest.frame (
Frame|Axis|Literal['none'] |str|Sequence[str] |bool, default:False) – Set frame and axes attributes for the plot. It can be a bool,"none", apygmt.params.Frameorpygmt.params.Axisobject. Raw GMT strings or sequences of strings are also supported for backward compatibility. Ifframe=True, the frame will be drawn with the default attributes. Ifframe="none", no frame will be drawn. Use apygmt.params.Frameorpygmt.params.Axisobject for more control over the attributes of the frame and axes. A tutorial is available at frame and axes attributes. Full documentation is at https://docs.generic-mapping-tools.org/6.7/gmt.html#b-full.verbose (
Literal['quiet','error','warning','timing','info','compat','debug'] |bool, default:False) – Select verbosity level [Full usage].panel (
int|Sequence[int] |bool, default:False) –Select a specific subplot panel. Only allowed when used in
Figure.subplotmode.Trueto advance to the next panel in the selected order.index to specify the index of the desired panel.
(row, col) to specify the row and column of the desired panel.
The panel order is determined by the
Figure.subplotmethod. row, col and index all start at 0.perspective (
float|Sequence[float] |str|bool, default:False) – Select perspective view and set the viewpoint. Pass apygmt.params.Perspectiveobject to control the viewpoint. Alternatively, setperspective=Trueto reuse the perspective setting from the previous plotting method. It also accepts following shortcuts: a single value azimuth, a sequence of two values (azimuth, elevation), or a sequence of three values (azimuth, elevation, level). Refer topygmt.params.Perspectivefor meaning of the parameters.transparency (
float|None, default:None) – Set transparency level, in [0-100] percent range [Default is0, i.e., opaque]. Only visible when PDF or raster format output is selected. Only the PNG format selection adds a transparency layer in the image (for further processing).
Examples
>>> import geopandas
>>> import pygmt
>>> world = geopandas.read_file(
...     "https://naciscdn.org/naturalearth/110m/cultural/ne_110m_admin_0_countries.zip"
... )
>>> world["POP_EST"] *= 1e-6  # Population in millions
>>>
>>> fig = pygmt.Figure()
>>> fig.basemap(region=[-19.5, 53, -38, 37.5], projection="M15c", frame=True)
>>> pygmt.makecpt(cmap="bilbao", series=(0, 270, 10), reverse=True)
>>> fig.choropleth(world, column="POP_EST", pen="0.3p,gray10")
>>> fig.colorbar(frame=True)
>>> fig.show()